Observability
If you have selected the Grafana feature in your Network, you will be able to observe much of the activity in the Clusters of that Network.
Grafana and Prometheus Distribution
The Hub cluster will run a Grafana server which will scrape Prometheus servers running in each of the Clusters of the Network
Grafana Dashboards
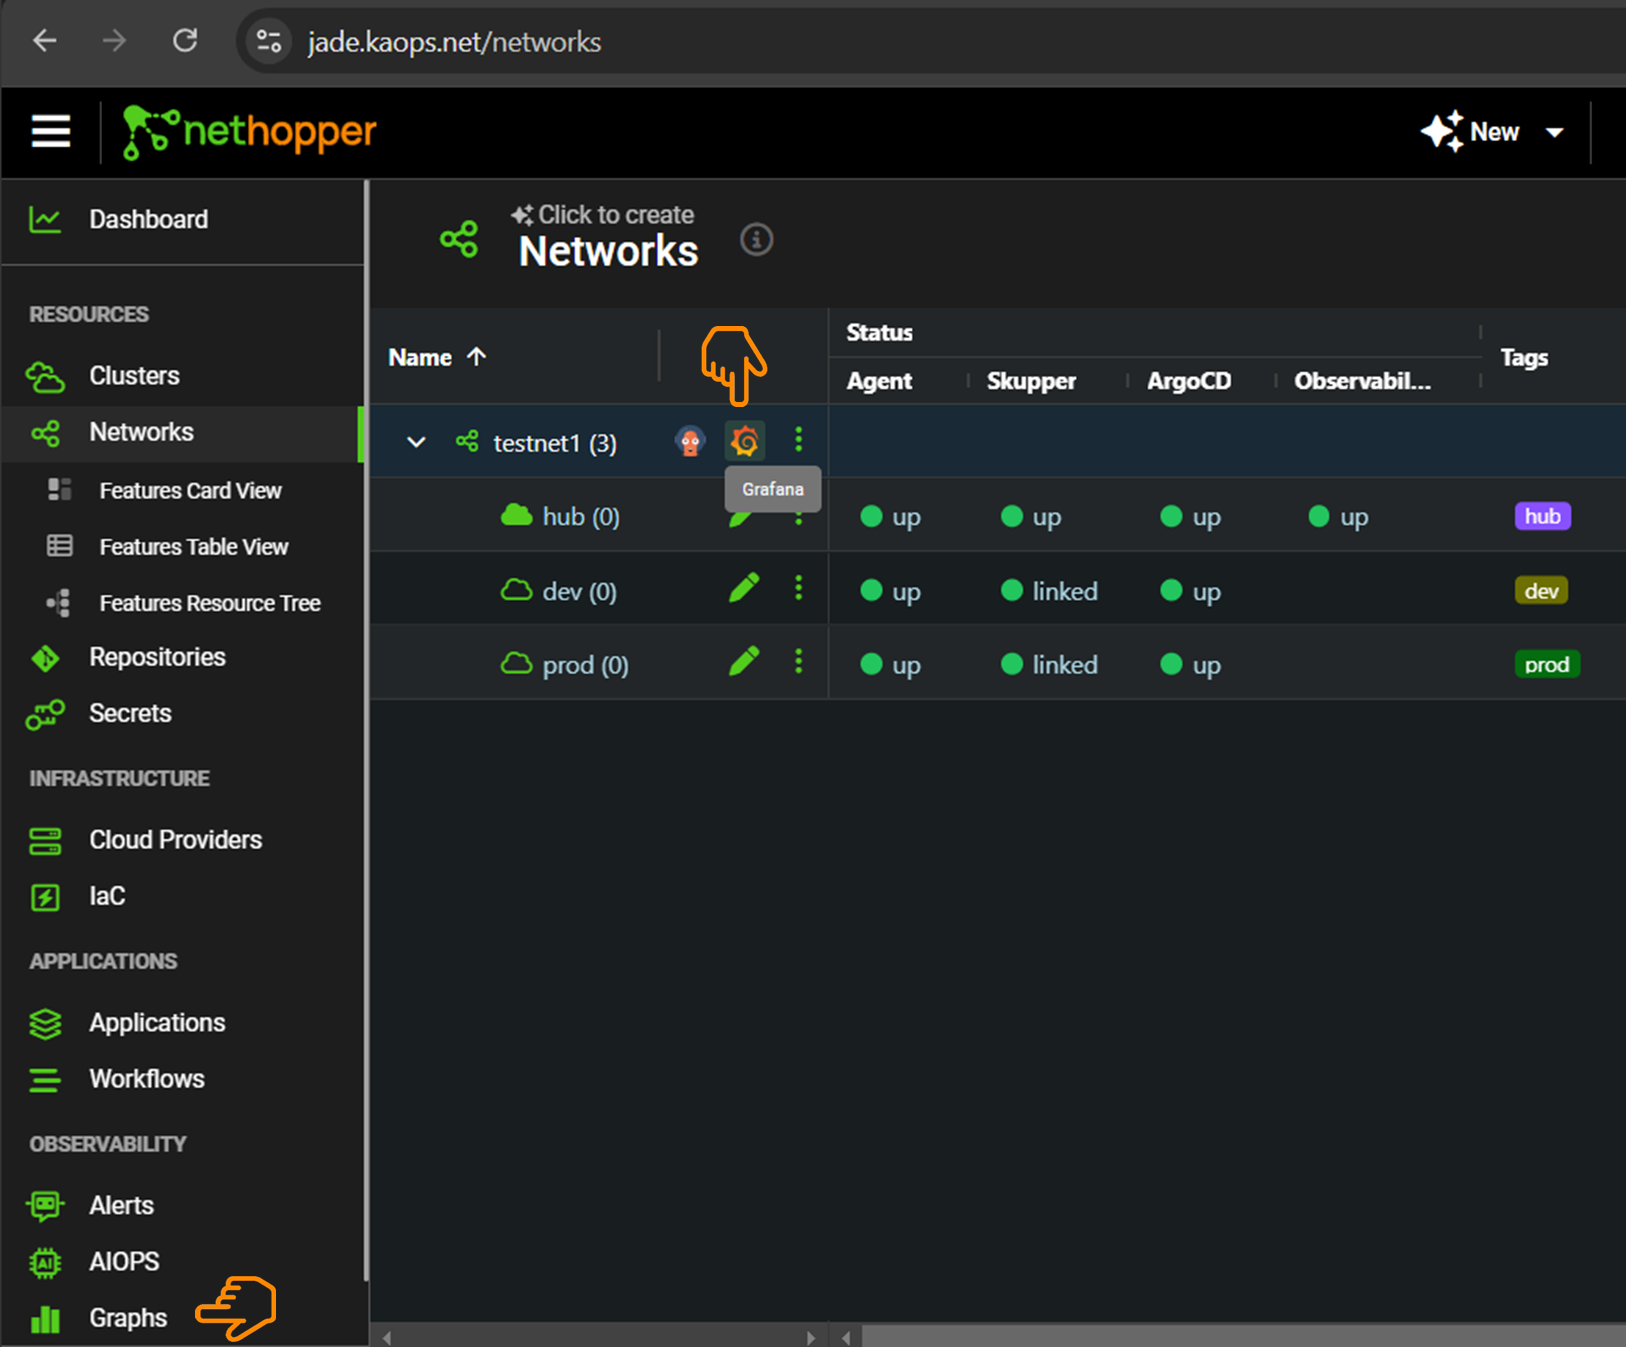
To access the Grafana dashboards, do one of the following:
- Click on the Grafana icon next to the network
- Click on the Observability -> Graphs page in the left Nav bar
Here, you will be given a username (admin) and password. Copy the password. And click, "Open URL".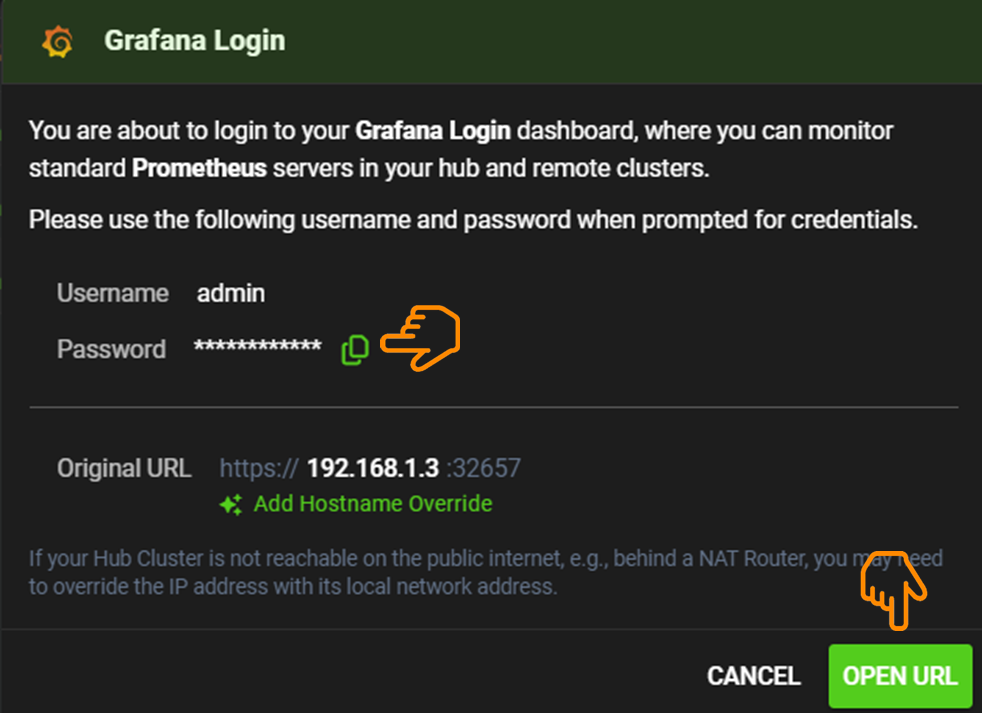
Enter the password in the new browser tab.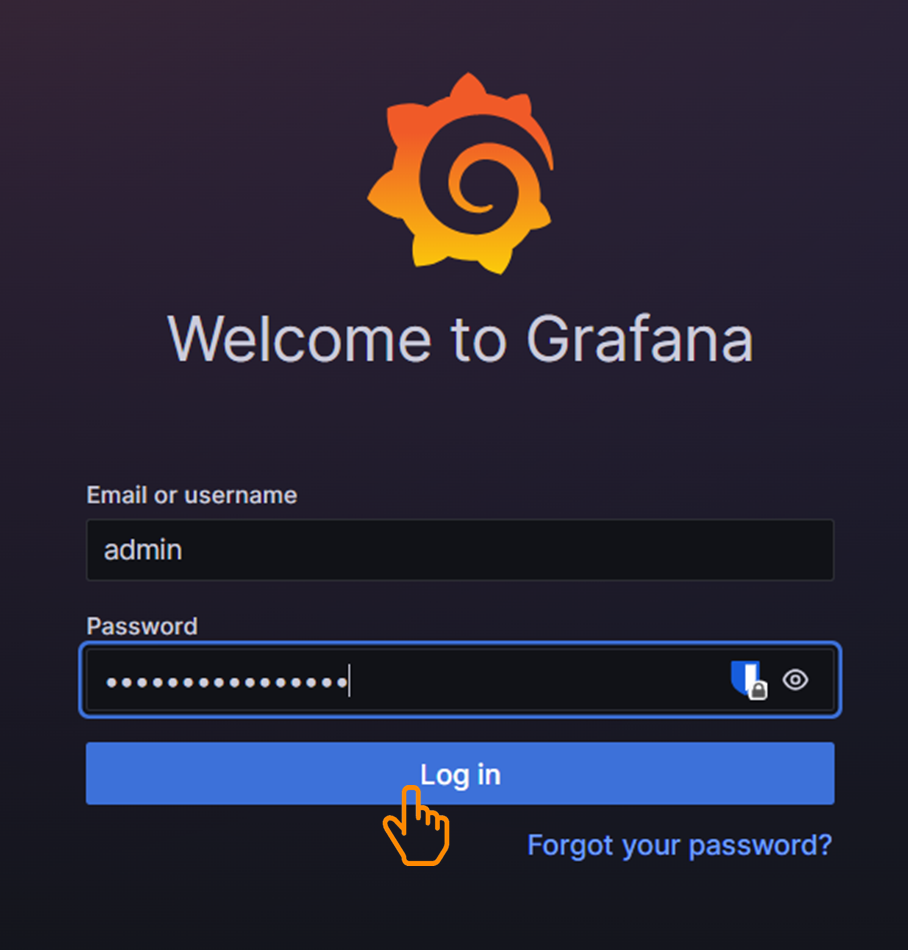
Now, you can see the 28 Dashboards available by clicking on the settings icon.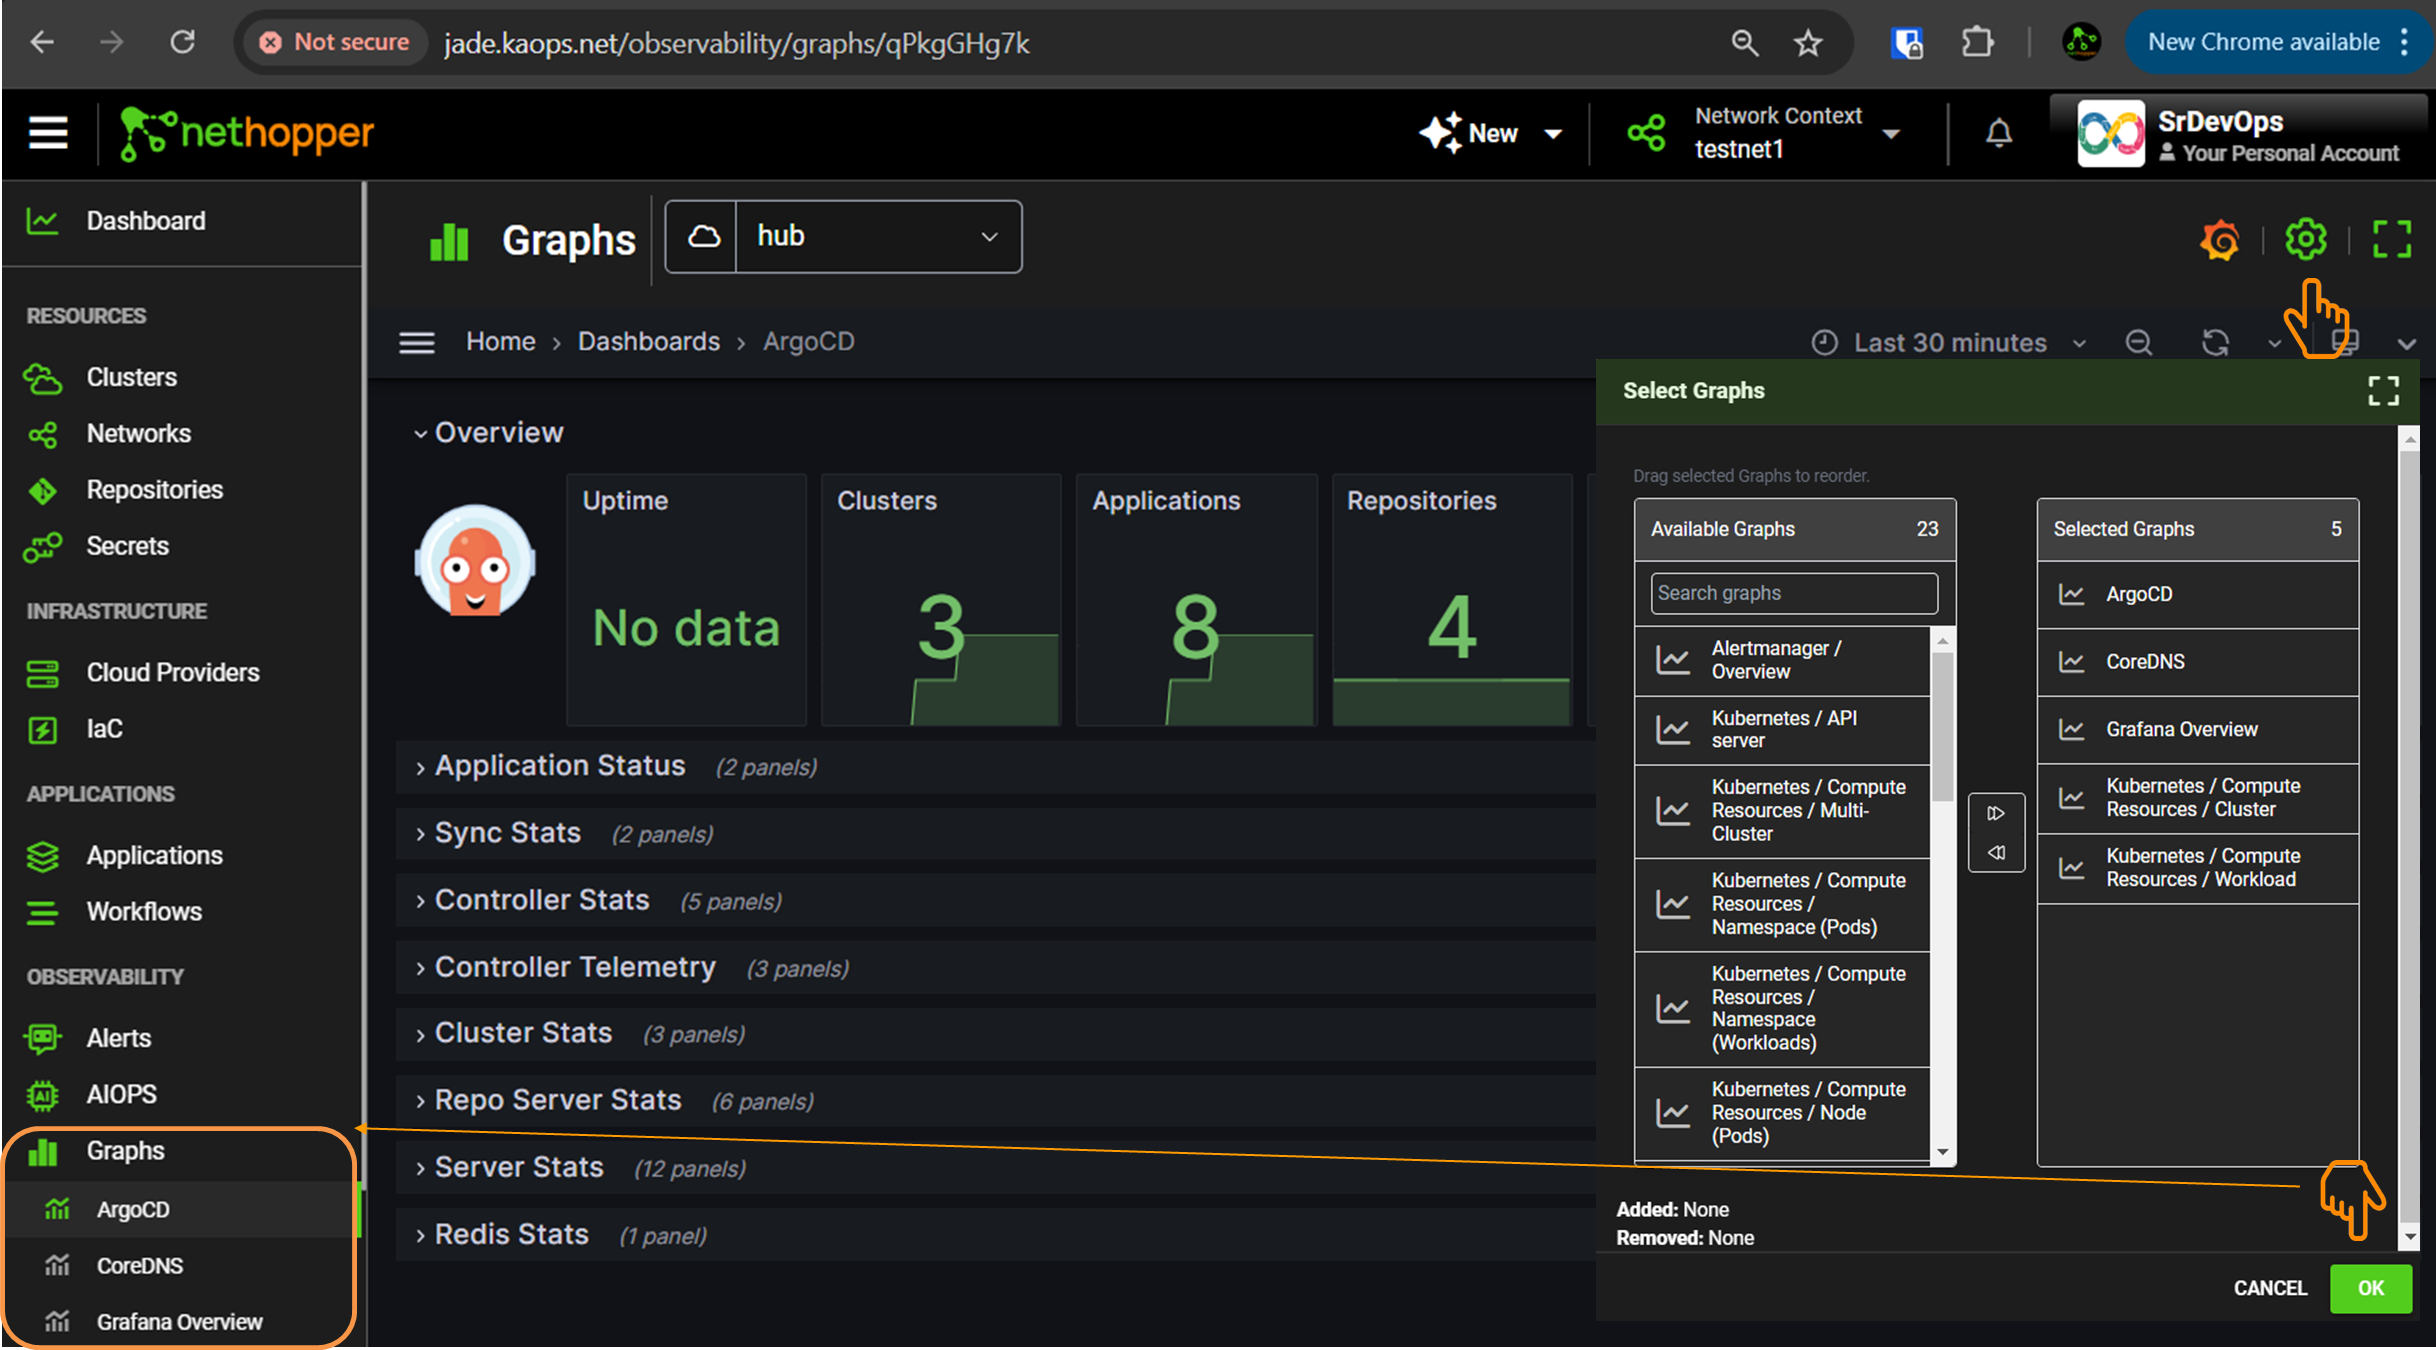
One of our favorites is the Kubernetes Compute Resources Graph. Click on it, and you will have a single pane of glass to see your resource utlization in all of the clusters of the Network. 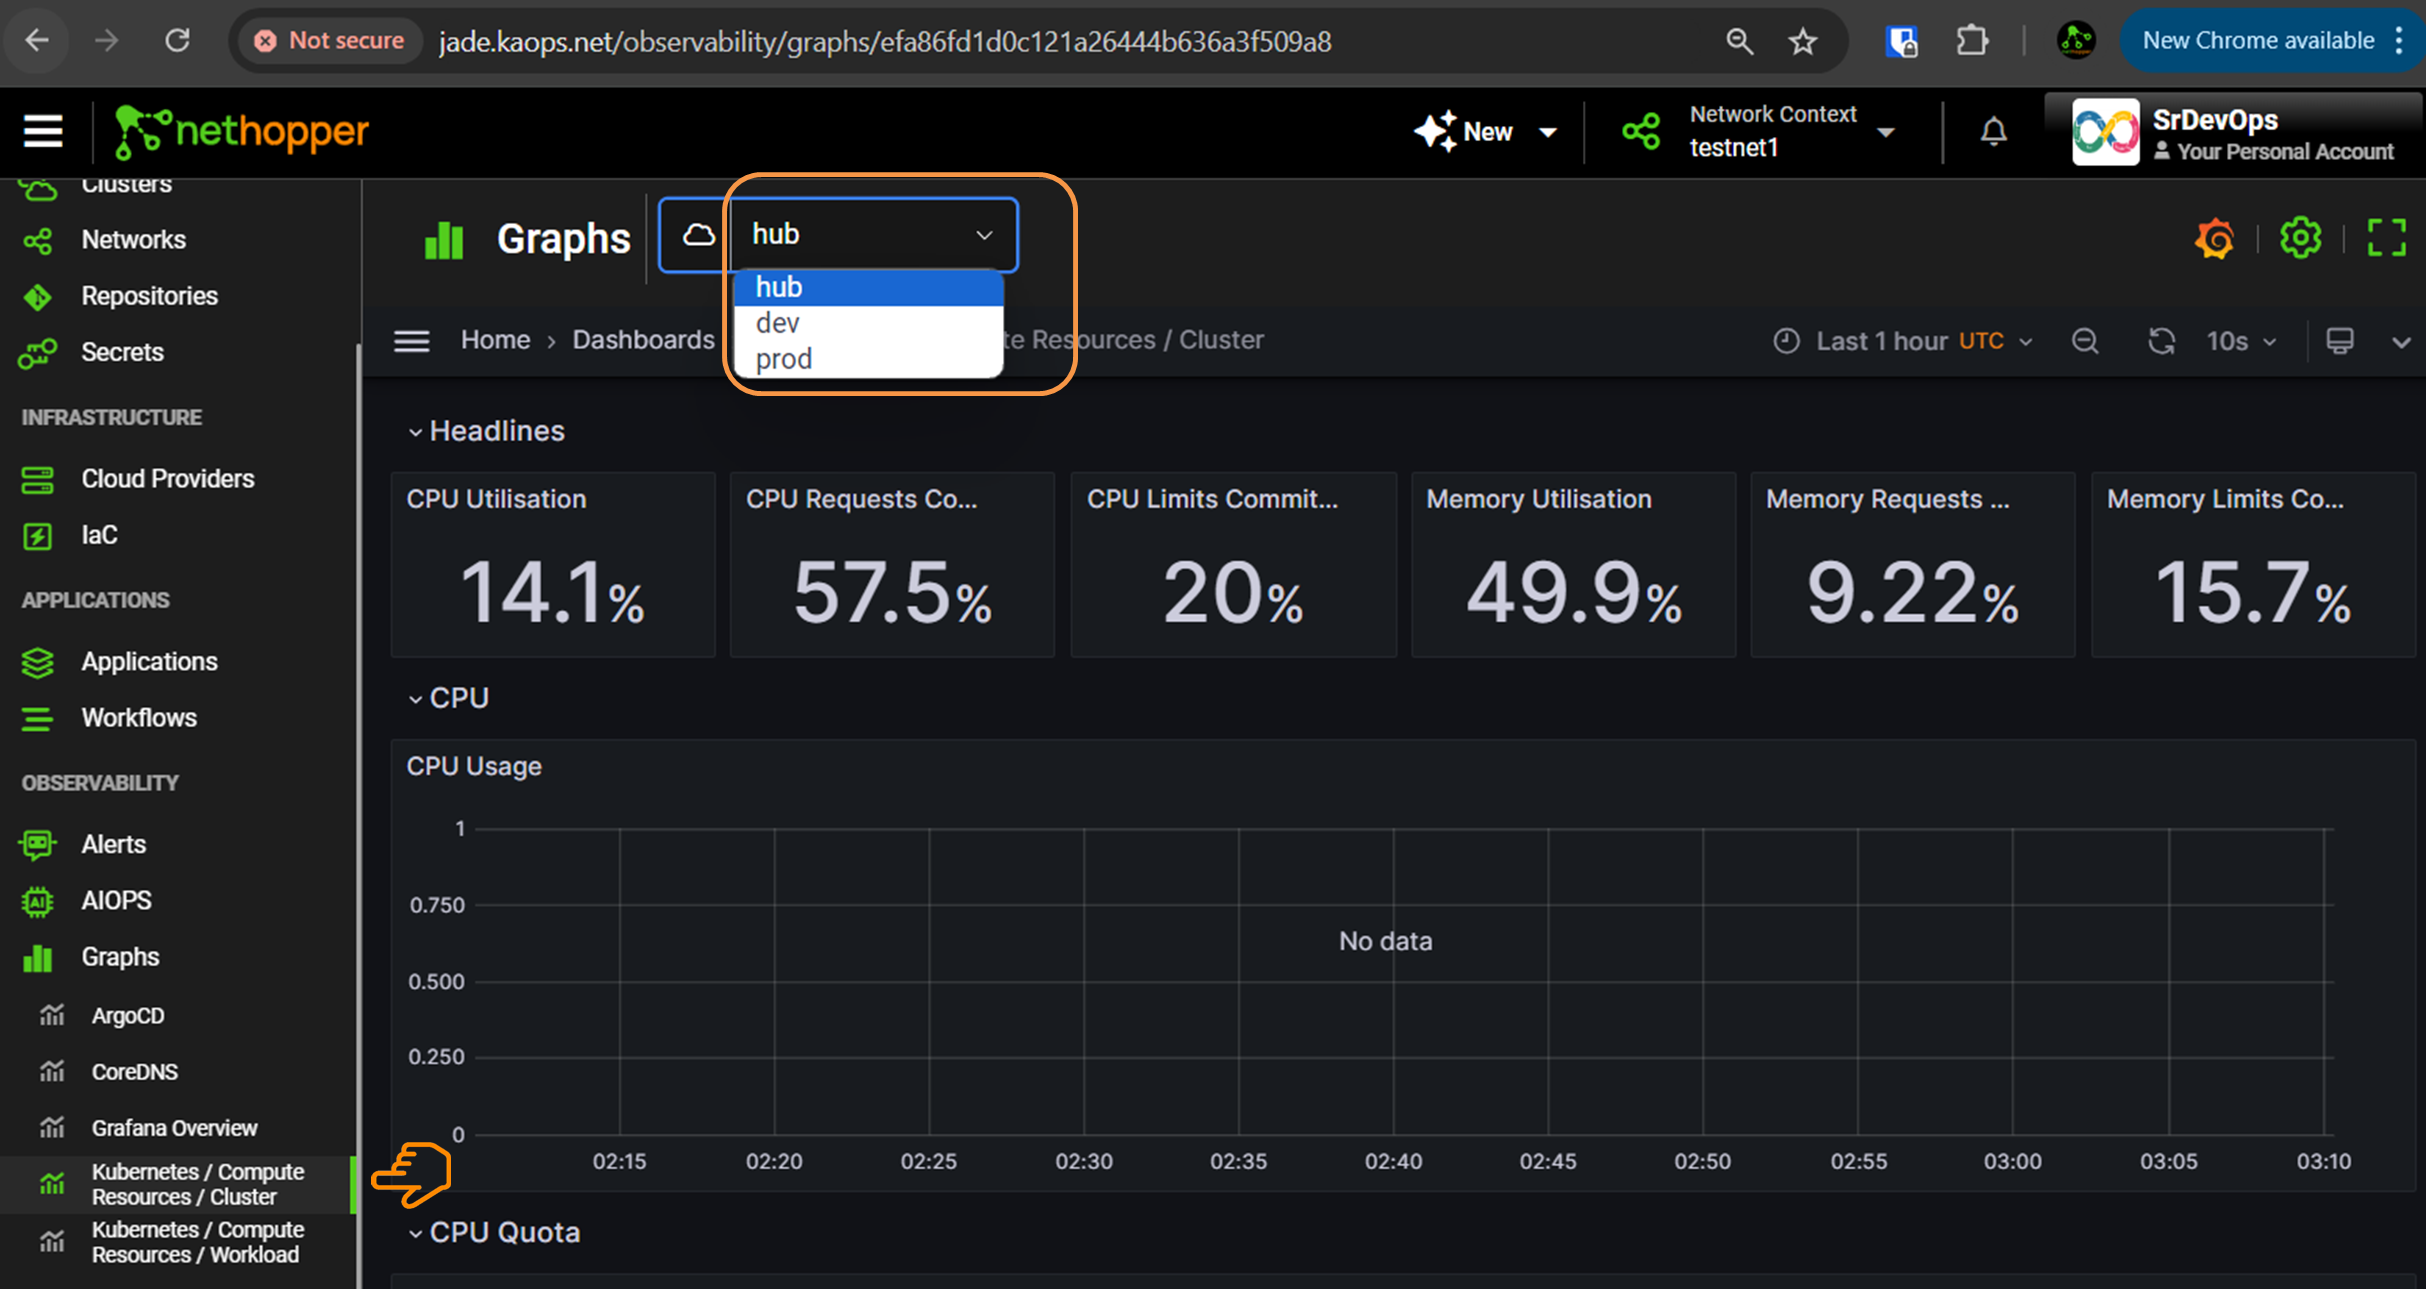
AI Ops (K8sGPT)
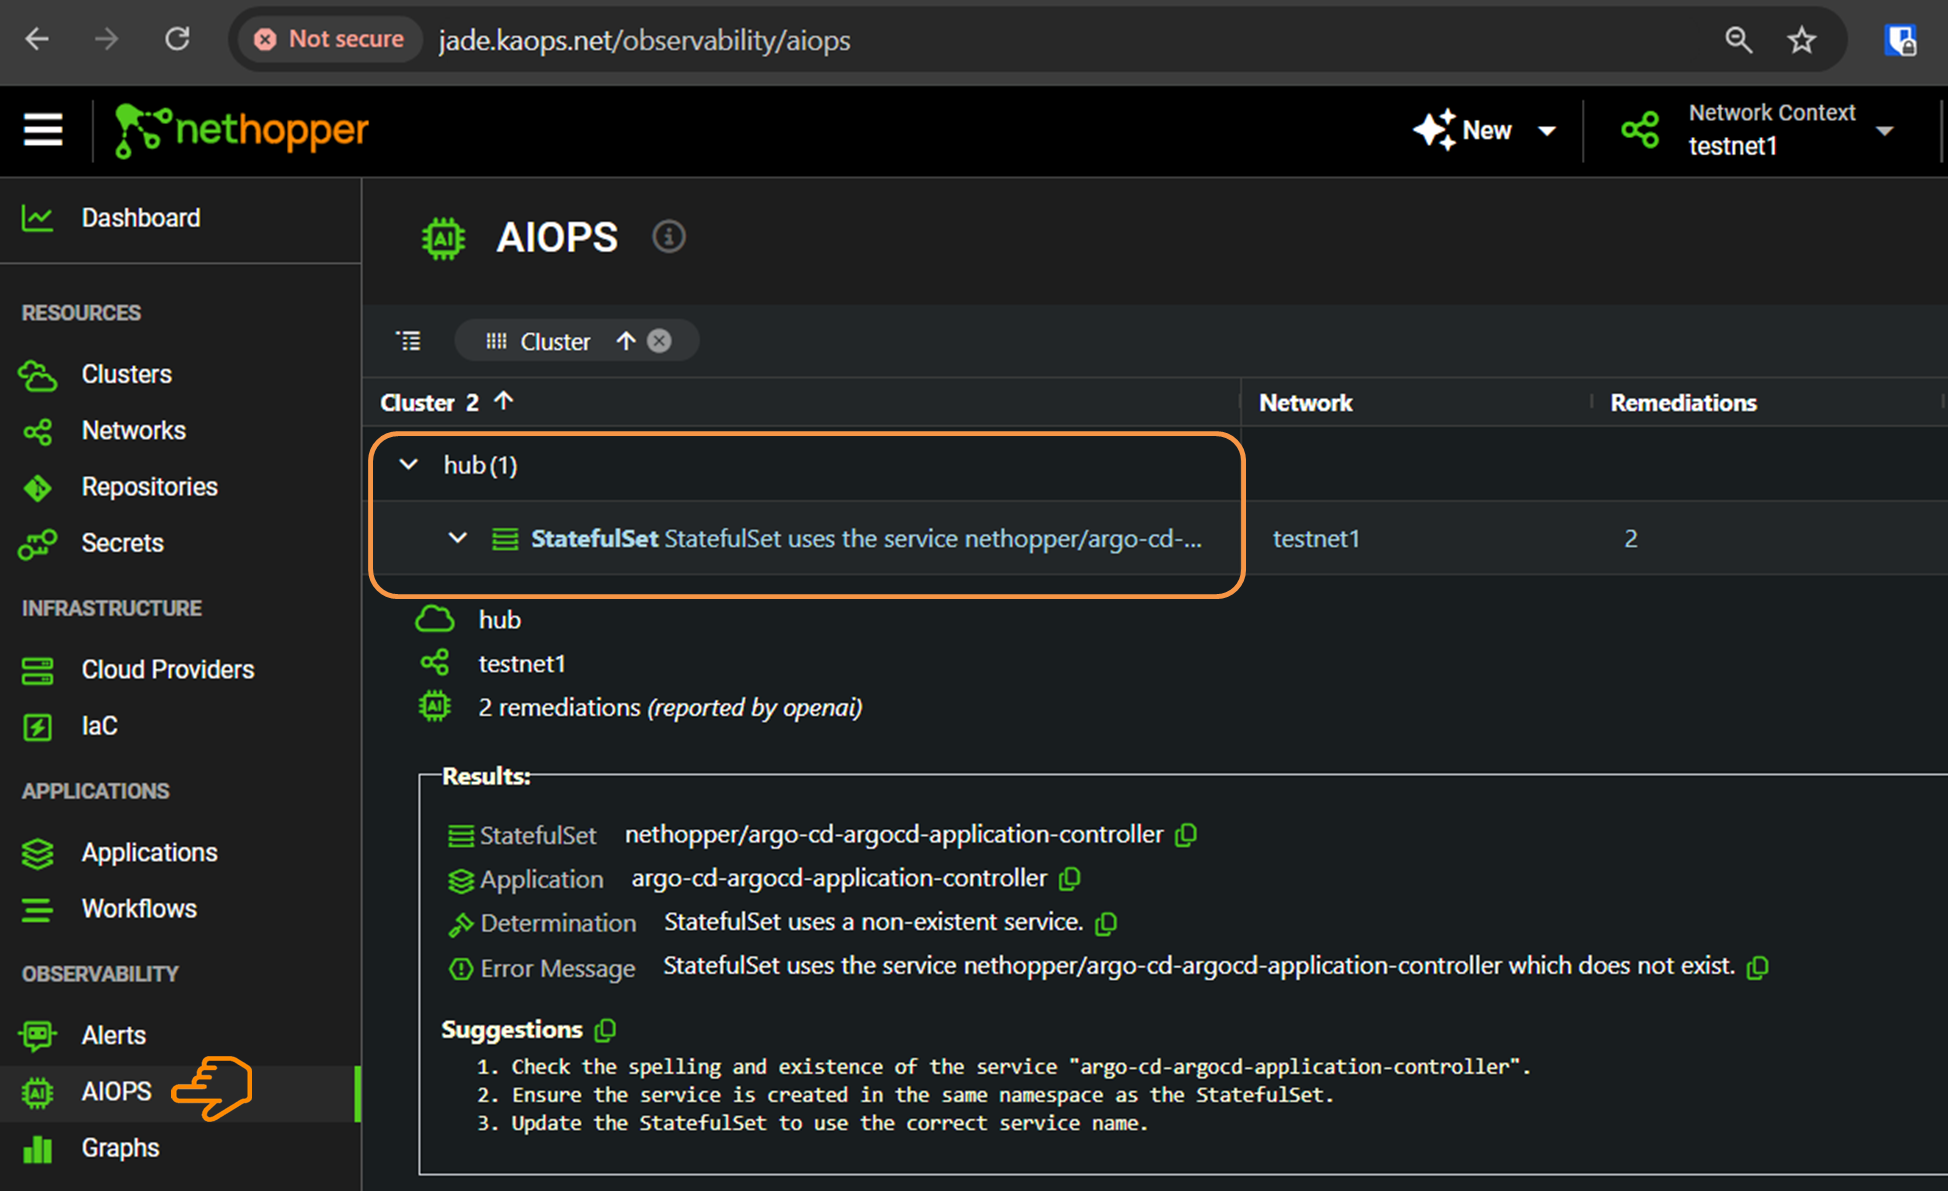
If you have enabled the AIOPs feature in the Network, you will have continuous AI analysis of your cluster resources, which will update every minute. AIOPs will scan for YAML configuration errors and give you a plain English explanation of the problem and the resolution. AIOPs can also be configured to do Trivvy CVE (Common Vulnerabilities and Exposures) scans.
Click on the Observability->AIOPs Nav page. You can see that AIOPs has captured one YAML configuration error in the Hub cluster, in the guestbook app. 